2D Interpolation Tutorial
2D interpolation is a fundamental operation for image resampling, oversampling, terrain extraction, etc. ISCE currently implements several basic types of interpolation methods: bilinear, bicubic, spline, and sinc interpolation. At the Python level, users will often work with NumPy arrays and are encouraged to use many of the available interpolation methods provided by NumPy and SciPy. Nevertheless, we provide Python interfaces to the ISCE interpolation routines for convenience and consistency.
We first generate a synthetic 2D low-resolution image which we wish to interpolate (this code follows the SciPy interp2d tutorial):
import numpy as np

# Create test data
x = np.arange(-5.01, 5.01, 0.25)
y = np.arange(-5.01, 5.01, 0.25)
xx, yy = np.meshgrid(x, y)
z = np.sin(xx**2 + yy**2)

# Create bin indices for the data
ny, nx = z.shape
x = np.arange(nx, dtype=float)
y = np.arange(ny, dtype=float)
Next, we will create interpolator objects for three different types of interpolators:
import isceextension

# Create interpolators
bilinear = isceextension.pyInterpolator(method='bilinear')
bicubic = isceextension.pyInterpolator(method='bicubic')
spline = isceextension.pyInterpolator(method='spline', order=6)
Next, generate arrays for the indices on which to interpolate at. Note, these indices are currently in units of image pixels, i.e. starting at (0,0) for the first pixel in the image and incrementing by one in both dimensions.
# Create coordinates we want to interpolate at
xnew = np.linspace(x[0], x[-1], 500)
ynew = np.full(xnew.shape, ny//2, dtype=float)
Interpolation simply involves passing these values to the interpolator objects.
# Interpolate
z_bilinear = bilinear.interpolate(xnew, ynew, z)
z_bicubic = bicubic.interpolate(xnew, ynew, z)
z_spline = spline.interpolate(xnew, ynew, z)
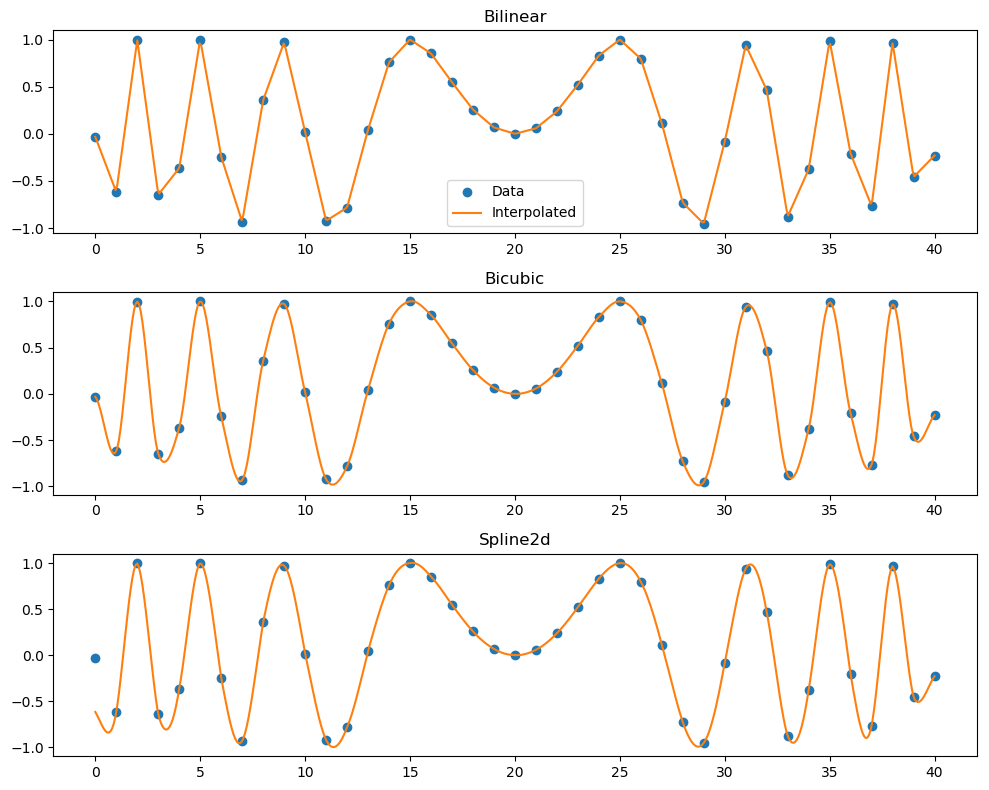
# Plot results
fig, (ax0, ax1, ax2) = plt.subplots(nrows=3, figsize=(10,8))
ax0.plot(x, z[ny//2,:], 'o', label='Data')
ax0.plot(xnew, z_bilinear, '-', label='Interpolated')
ax0.set_title('Bilinear')
leg = ax0.legend(loc='best')
ax1.plot(x, z[ny//2,:], 'o')
ax1.plot(xnew, z_bicubic, '-')
ax1.set_title('Bicubic')
ax2.plot(x, z[ny//2,:], 'o')
ax2.plot(xnew, z_spline, '-')
ax2.set_title('Spline2d')